Exhibit 99.1
InfuSystem Holdings, Inc. Shareholders Q3?13 Presentation November 18, 2013 Eric K. Steen, CEO Jonathan P. Foster, CFO Infusystem Infusion made easy

Safe Harbor Statement Certain statements contained in this release are forward?looking statements and are based on future expectations, plans and prospects for InfuSystem Holdings, Inc.’s (“InfuSystem”, “INFU”, “the Company”, “We”) business and operations that involve a number of risks and uncertainties. InfuSystem’s outlook for 2013 and other forward?looking statements in this release are made as of November 18, 2013, and the Company disclaims any duty to supplement, update or revise such statements on a going?forward basis, whether as a result of subsequent developments, changed expectations or otherwise. In connection with the “safe harbor” provisions of the Private Securities Litigation Reform Act of 1995, the Company is identifying certain factors that could cause actual results to differ, perhaps materially, from those indicated by these forwardlooking statements. Those factors, risks and uncertainties include, but are not limited to, potential changes in overall healthcare reimbursement – including CMS competitive bidding, sequestration, concentration of customers, increased focus on early detection of cancer, competitive treatments, dependency on Medicare Supplier Number, availability of chemotherapy drugs, global financial conditions, changes and enforcement of state and federal laws, natural forces, competition, dependency on suppliers, risks in acquisitions & joint ventures, US Healthcare Reform, relationships with healthcare professionals and organizations, technological changes related to infusion therapy, dependency on websites and intellectual property, the ability of the Company to successfully integrate acquired businesses, dependency on key personnel, dependency on banking relations and covenants, and other risks associated with our common stock, as well as any other litigation to which the Company may be subject from time to time; and other risk factors as discussed in the Company’s annual report on Form 10?K for the year ended December 31, 2012 and in other filings made by the Company from time to time with the Securities and Exchange Commission. Infusystem Infusion made easy
Positioned for Growth Infusystem Infusion made easy

Positioned For Growth Market Trends • InfuSystemis positioned extremely well to take advantage of market trends Strategy • Transformational strategy is developed and being implemented Leadership • Leadership can now focus on running a business for first time in over a year Infusystem Infusion made easy
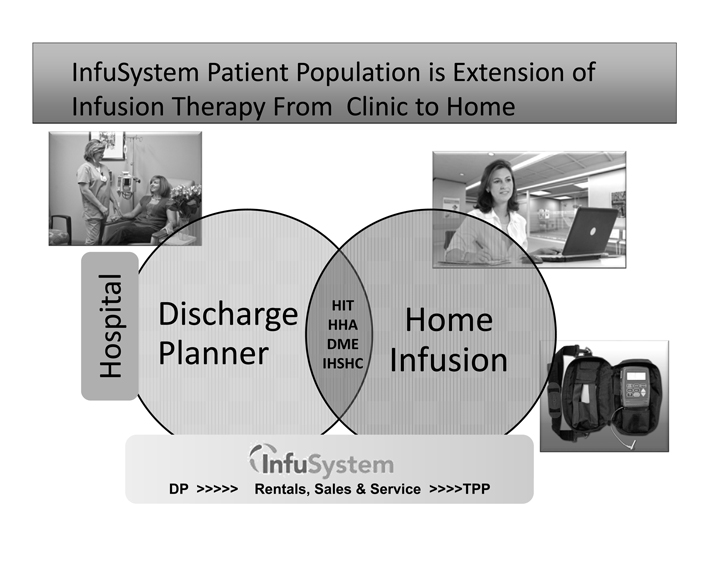
InfuSystem Patient Population is Extension of Infusion Therapy From Clinic to Home Discharge Planner Home Infusion DP >>>>> Rentals, Sales & Service >>>>TPP Hospital HIT HHA DME IHSHC ? 2 ? 1? 28 ? 47 ? 14 ? 18 ? 2 ? 26 ? 7 ? 7 ? 27? 19 ? 28 ? 12 ? 2 ? 13 ? 12 ? 25 ? 18 ? 1 ? 3 ? 31 ? 13 ? 59 ? 7 ? 2 ? 1 Servicing all 50 States & Canada “In?network” in over 250 health plans covering 222+mm lives 1,600+ active healthcare facilities in Third?Party Payor business Infusystem
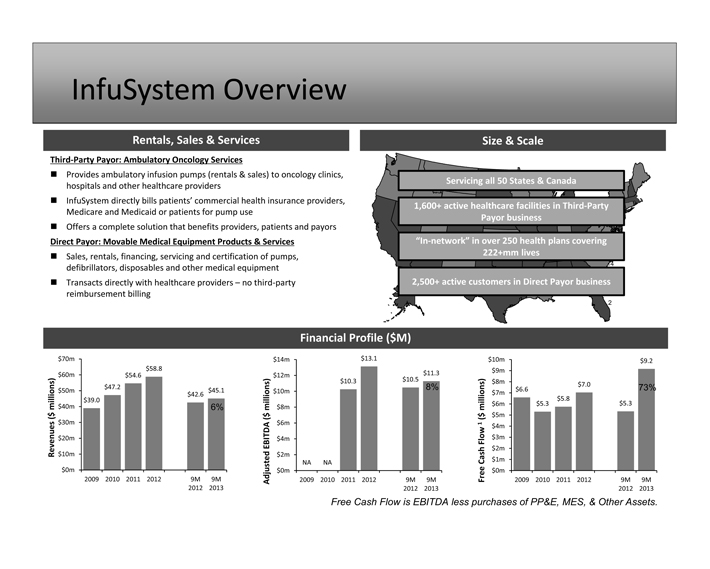
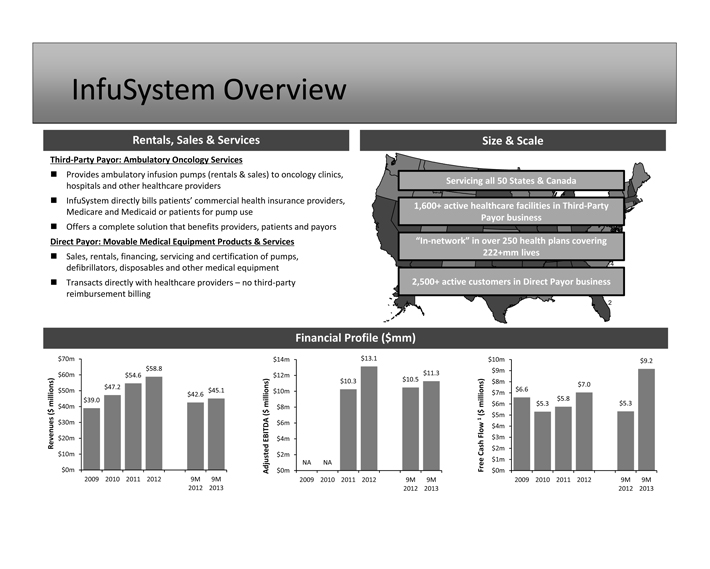
InfuSystem Overview Rentals, Sales & Services Size & Scale Third?Party Payor: Ambulatory Oncology Services ? Provides ambulatory infusion pumps (rentals & sales) to oncology clinics, hospitals and other healthcare providers ? InfuSystem directly bills patients’ commercial health insurance providers, Medicare and Medicaid or patients for pump use ? Offers a complete solution that benefits providers, patients and payors Direct Payor: Movable Medical Equipment Products & Services ? Sales, rentals, financing, servicing and certification of pumps, defibrillators, disposables and other medical equipment ? Transacts directly with healthcare providers – no third?party reimbursement billing 2,500+ active customers in Direct Payor business (1) Financial Profile ($M) $39.0 $47.2 $54.6 $58.8 $42.6 $45.1 $0m $10m $20m $30m $40m $50m $60m $70m 2009 2010 2011 2012 9M 2012 9M 2013 Revenues ($ millions) NA NA $10.3 $13.1 $10.5 $11.3 $0m $2m $4m $6m $8m $10m $12m $14m 2009 2010 2011 2012 9M 2012 9M 2013 Adjusted EBITDA ($ millions) 8% $6.6 $5.3 $5.8 $7.0 $5.3 $9.2 $0m $1m $2m $3m $4m $5m $6m $7m $8m $9m $10m 2009 2010 2011 2012 9M 2012 9M 2013 Free Cash Flow 1 ($ millions) 6% 73% Free Cash Flow is EBITDA less purchases of PP&E, MES, & Other Assets.
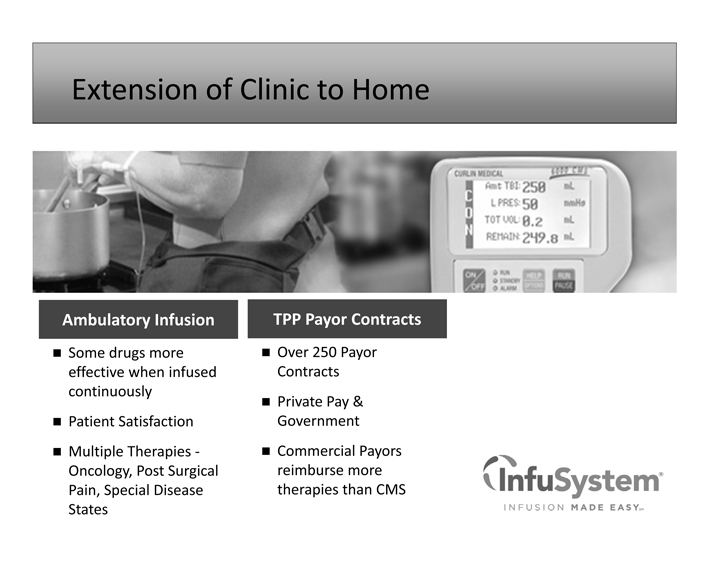
Extension of Clinic to Home Ambulatory Infusion ? Some drugs more effective when infused continuously ? Patient Satisfaction ? Multiple Therapies ? Oncology, Post Surgical Pain, Special Disease States TPP Payor Contracts ? Over 250 Payor Contracts ? Private Pay & Government ? Commercial Payors reimburse more therapies than CMS Infusystem Infusion made easy
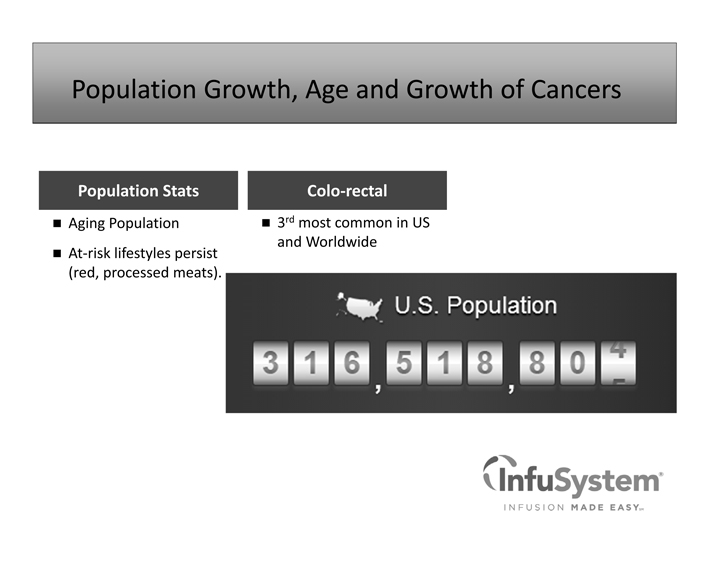
Population Growth, Age and Growth of Cancers Population Stats ? Aging Population ? At?risk lifestyles persist (red, processed meats). Colo?rectal ? 3rd most common in US and Worldwide Infusystem Infusion made easy u.s. population
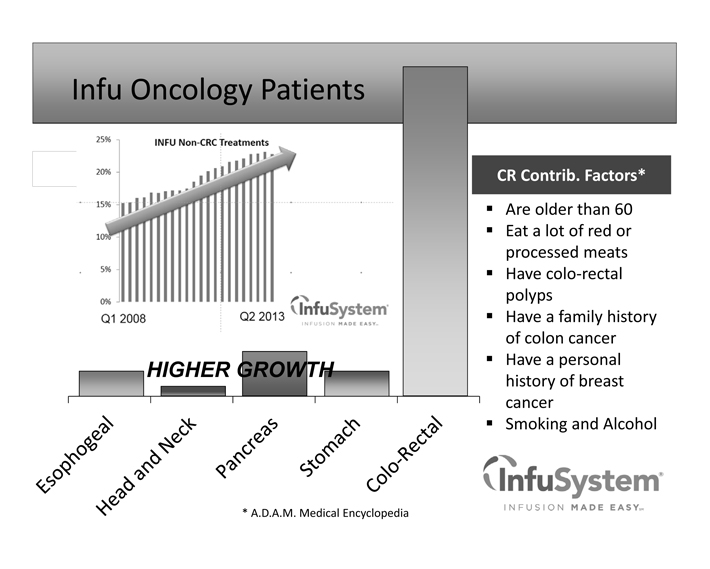
Infu Oncology Patients CR Contrib. Factors* ? Are older than 60 ? Eat a lot of red or processed meats ? Have colo?rectal polyps ? Have a family history of colon cancer ? Have a personal history of breast cancer ? Smoking and Alcohol * A.D.A.M. Medical Encyclopedia HIGHER GROWTH Infusystem Infusion made easy Esophageal Head and neck Pancreas Stomach Colo-rectal Infu non-crc treatments
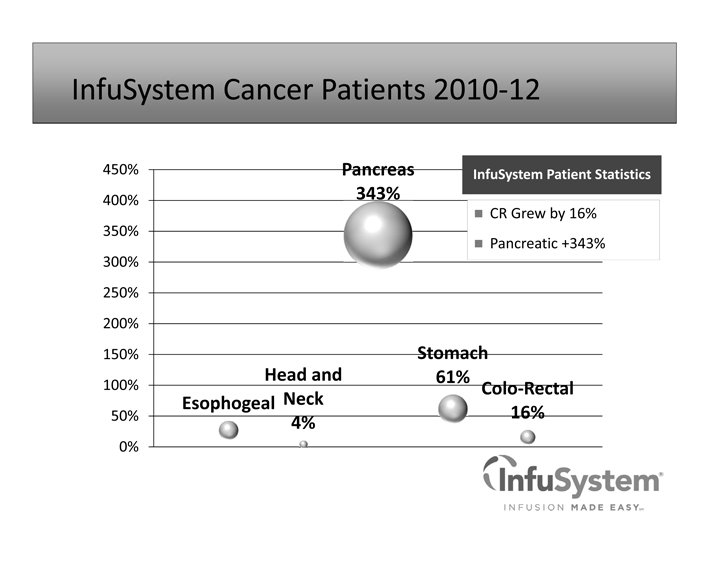
InfuSystem Cancer Patients 2010?12 Esophogeal Head and Neck 4% Pancreas 343% Stomach 61% Colo?Rectal 16% 0% 50% 100% 150% 200% 250% 300% 350% 400% 450% InfuSystem Patient Statistics ? CR Grew by 16% ? Pancreatic +343% Infusystem Infusion made easy
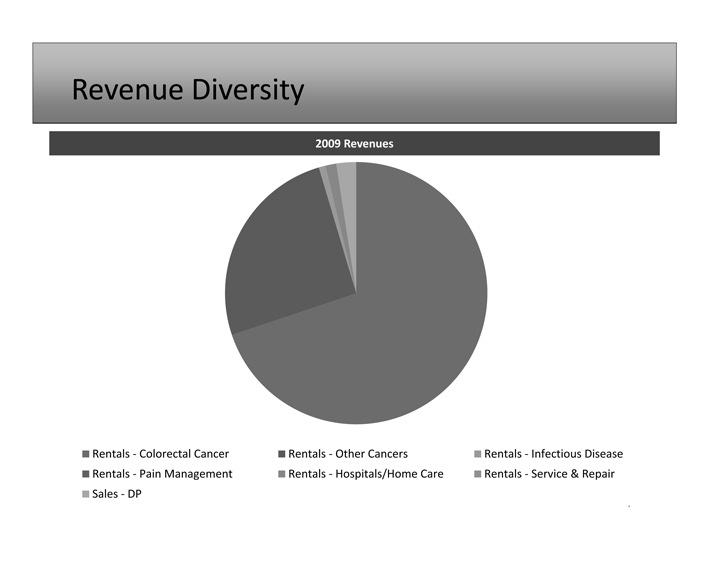
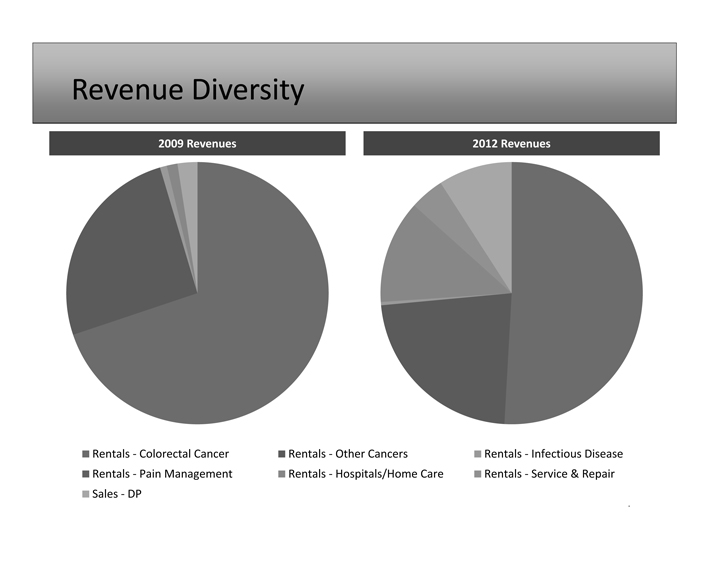
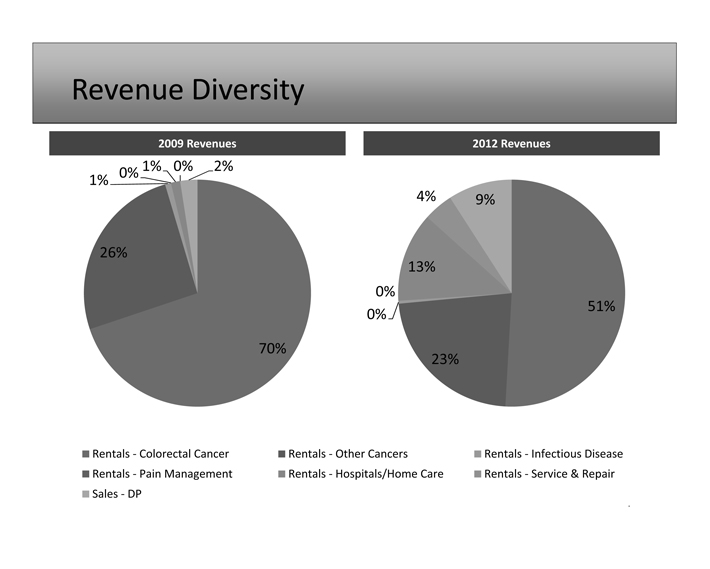
Revenue Diversity 2009 Revenues 2012 Revenues Rentals ? Colorectal Cancer Rentals ? Other Cancers Rentals ? Infectious Disease Rentals ? Pain Management Rentals ? Hospitals/Home Care Rentals ? Service & Repair Sales ? DP 2009 Revenues
Revenue Diversity 2009 Revenues 2012 Revenues Rentals Colorectal Cancer Rentals Other Cancers Rentals Infectious Disease Rentals Pain Management Rentals Hospitals/Home Care Rentals Service & Repair Sales DP
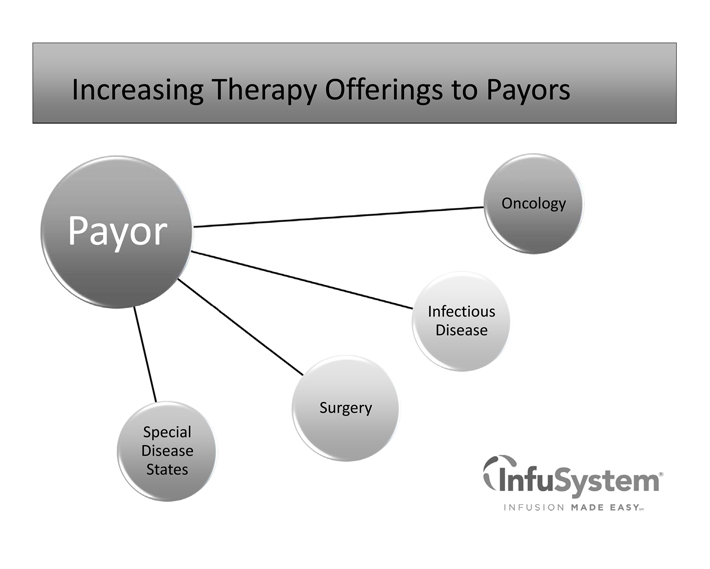
Increasing Therapy Offerings to Payors Payor Infectious Disease Surgery Special Disease States Oncology Infusystem Infusion made easy
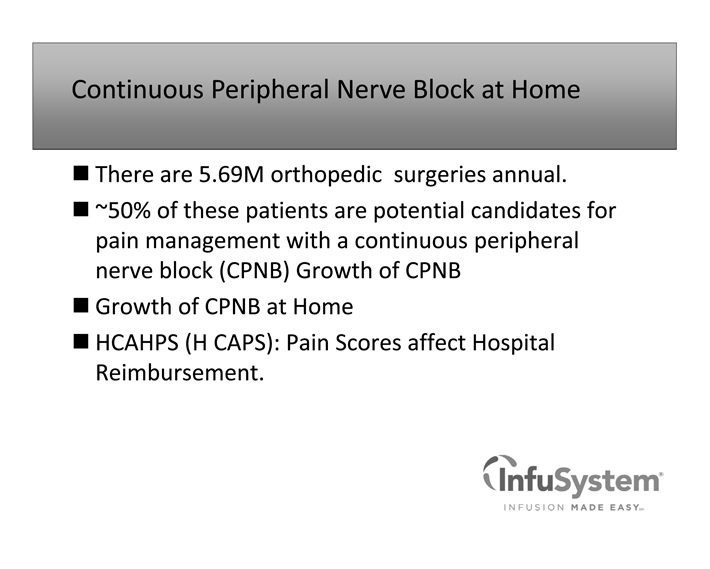
Continuous Peripheral Nerve Block at Home There are 5.69M orthopedic surgeries annual. ~50% of these patients are potential candidates for pain management with a continuous peripheral nerve block (CPNB) Growth of CPNB Growth of CPNB at Home HCAHPS (H CAPS): Pain Scores affect Hospital Reimbursement. Infusystem Infusion made easy
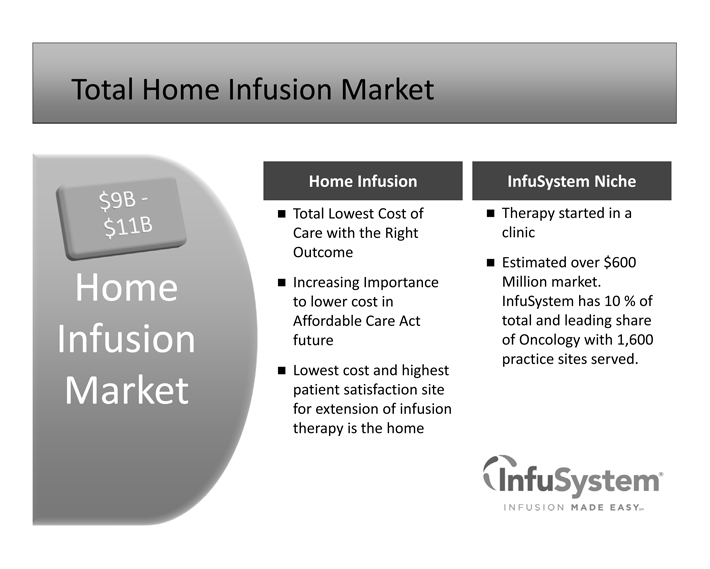
Total Home Infusion Market Home Infusion Market Home Infusion Total Lowest Cost of Care with the Right Outcome Increasing Importance to lower cost in Affordable Care Act future Lowest cost and highest patient satisfaction site for extension of infusion therapy is the home InfuSystem Niche Therapy started in a clinic Estimated over $600 Million market. InfuSystem has 10 % of total and leading share of Oncology with 1,600 practice sites served. Infusystem Infusion made easy
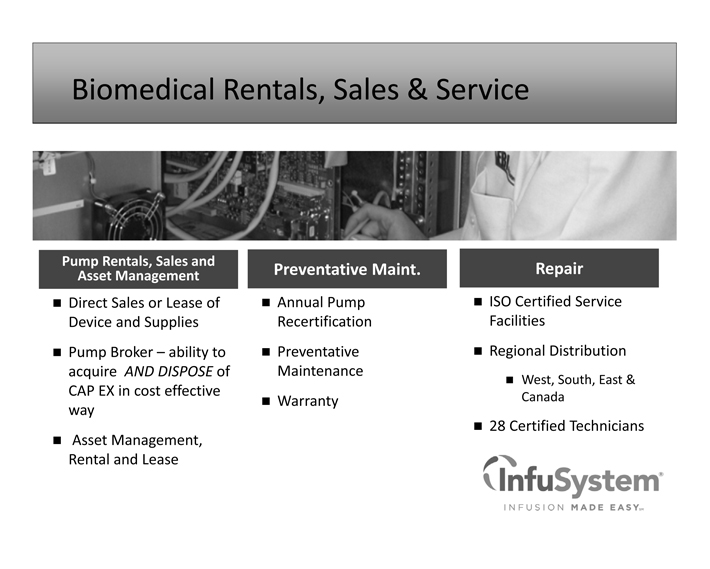
Biomedical Rentals, Sales & Service Pump Rentals, Sales and Asset Management Direct Sales or Lease of Device and Supplies Pump Broker – ability to acquire AND DISPOSE of CAP EX in cost effective way Asset Management, Rental and Lease Preventative Maint. Annual Pump Recertification Preventative Maintenance Warranty Repair ISO Certified Service Facilities Regional Distribution West, South, East & Canada 28 Certified Technicians Infusystem Infusion made easy

Offering Infusion to All Points of Care Provider Long Term Care Emergency Services Acute Care Oncology Home Infusion Infusystem Infusion made easy
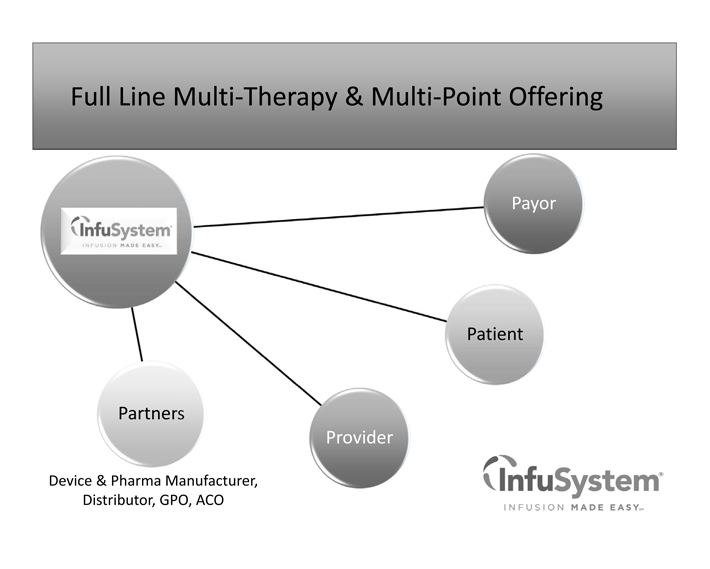
Full Line Multi Therapy & Multi Point Offering Payor Partners Provider Patient Device & Pharma Manufacturer, Distributor, GPO, ACO Infusystem Infusion made easy
What a Difference a Year Makes Financial Position New Team in place IT improvements begun New Product launches Kits, Smart Pumps, Post Surgical Pain Infusystem Infusion made easy
IT and Automation Shift into High Gear More insurance billings with existing staff Greater revenue per employee Road Map completed , New iPad features, Automation of initial internal processes Infusystem Infusion made easy
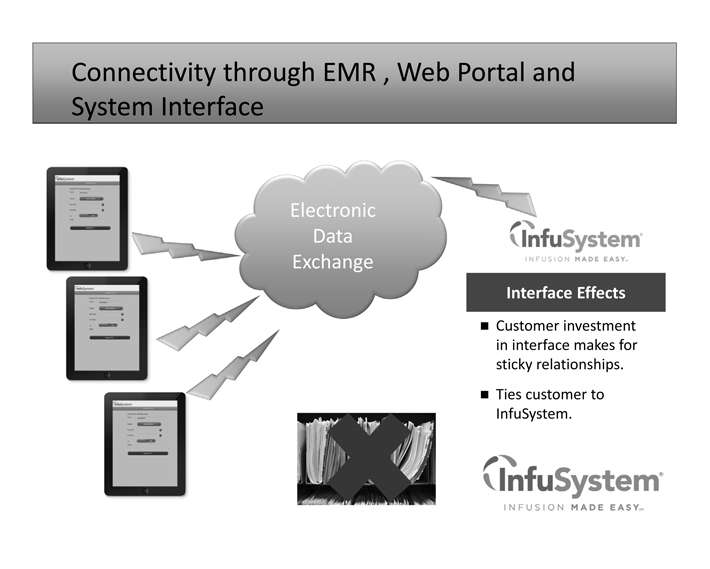
Connectivity through EMR , Web Portal and System Interface Electronic Data Exchange Interface Effects Customer investment in interface makes for sticky relationships. Ties customer to InfuSystem. Infusystem Infusion made easy
Connectivity through EMR , Web Portal and System Interface Electronic Data Exchange Interface Effects Customer investment in interface makes for sticky relationships. Ties customer to InfuSystem. Infusystem Infusion made easy
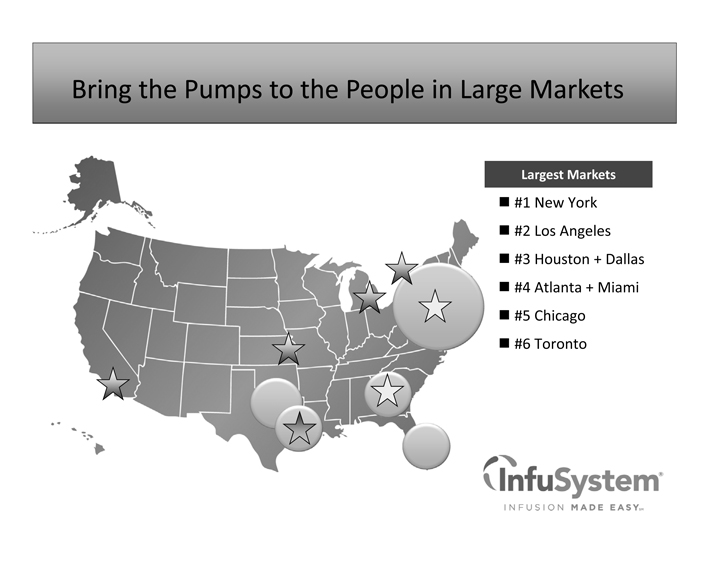
Bring the Pumps to the People in Large Markets Largest Markets #1 New York #2 Los Angeles #3 Houston + Dallas #4 Atlanta + Miami #5 Chicago #6 Toronto Infusystem Infusion made easy
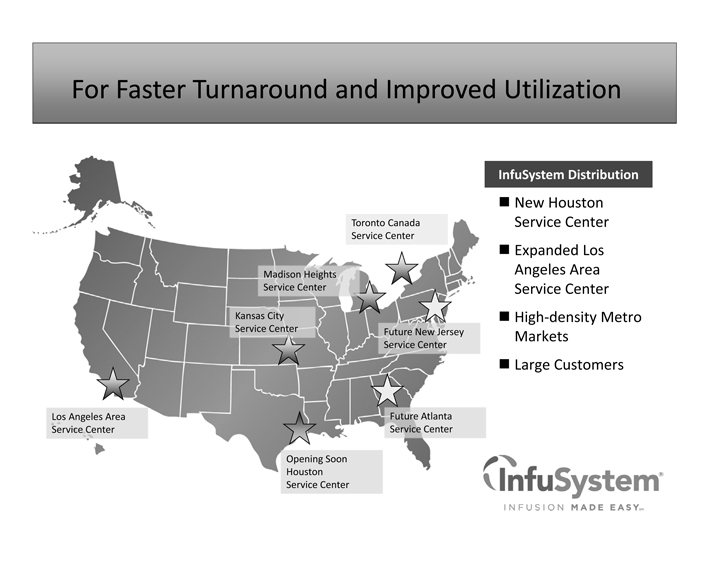
For Faster Turnaround and Improved Utilization Kansas City Service Center Madison Heights Service Center Future New Jersey Service Center Future Atlanta Service Center Los Angeles Area Service Center Opening Soon Houston Service Center Toronto Canada Service Center InfuSystem Distribution New Houston Service Center Expanded Los Angeles Area Service Center High density Metro Markets Large Customers Infusystem Infusion made easy
Where Does This Get INFU in Three Years Aging Population and Cancer growth More Patients Home IV , commercial pay recognizing value, CMS competitive bidding Peripheral Nerve Block and Smart Pump Growth Revenue Growth in High Single Digits Infusystem Infusion made easy
Next Up Action Items IT Implementation – web portal, EMR, interfaces, automation of insurance processes Product and service line expansion Geographic Expansion Productivity measures implemented Evaluating depreciable life Utilization metrics and improvement Infusystem Infusion made easy
Positioned For Growth Market Trends • InfuSystemis positioned extremely well to take advantage of market trends Strategy • Transformational strategy is developed and being implemented Leadership • Leadership can now focus on running a business for first time in over a year Infusystem Infusion made easy
Financial Review Infusystem Infusion made easy
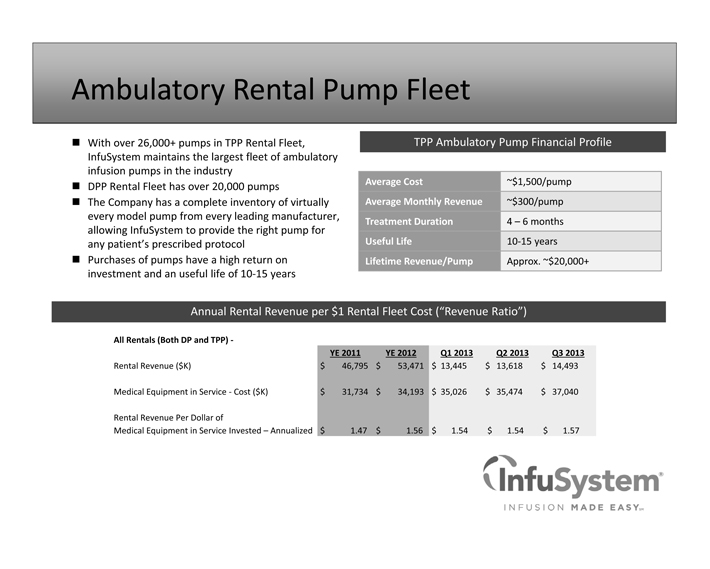
Ambulatory Rental Pump Fleet TPP Ambulatory Pump Financial Profile Annual Rental Revenue per $1 Rental Fleet Cost (“Revenue Ratio”) With over 26,000+ pumps in TPP Rental Fleet, InfuSystem maintains the largest fleet of ambulatory infusion pumps in the industry DPP Rental Fleet has over 20,000 pumps The Company has a complete inventory of virtually every model pump from every leading manufacturer, allowing InfuSystem to provide the right pump for any patient’s prescribed protocol Purchases of pumps have a high return on investment and an useful life of 10 15 years Average Cost ~$1,500/pump Average Monthly Revenue ~$300/pump Treatment Duration 4 – 6 months Useful Life 10 15 years Lifetime Revenue/Pump Approx. ~$20,000+ All Rentals (Both DP and TPP) YE 2011 YE 2012 Q1 2013 Q2 2013 Q3 2013 Rental Revenue ($K) $ 46,795 $ 53,471 $ 13,445 $ 13,618 $ 14,493 Medical Equipment in Service Cost ($K) $ 31,734 $ 34,193 $ 35,026 $ 35,474 $ 37,040 Rental Revenue Per Dollar of Medical Equipment in Service Invested – Annualized $ 1.47 $ 1.56 $ 1.54 $ 1.54 $ 1.57 Infusystem Infusion made easy
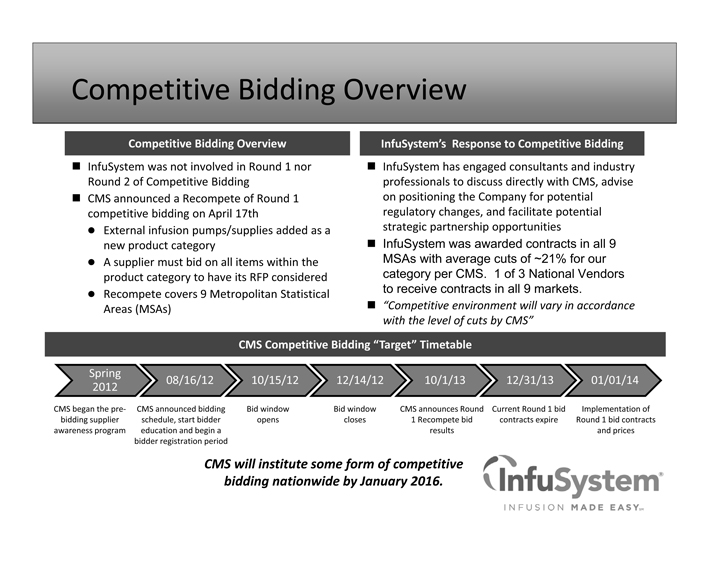
Competitive Bidding Overview InfuSystem was not involved in Round 1 nor Round 2 of Competitive Bidding CMS announced a Recompete of Round 1 competitive bidding on April 17th External infusion pumps/supplies added as a new product category A supplier must bid on all items within the product category to have its RFP considered Recompete covers 9 Metropolitan Statistical Areas (MSAs) Competitive Bidding Overview InfuSystem’s Response to Competitive Bidding InfuSystem has engaged consultants and industry professionals to discuss directly with CMS, advise on positioning the Company for potential regulatory changes, and facilitate potential strategic partnership opportunities InfuSystem was awarded contracts in all 9 MSAs with average cuts of ~21% for our category per CMS. 1 of 3 National Vendors to receive contracts in all 9 markets. “Competitive environment will vary in accordance with the level of cuts by CMS” CMS Competitive Bidding “Target” Timetable CMS will institute some form of competitive bidding nationwide by January 2016. CMS began the prebidding supplier awareness program CMS announced bidding schedule, start bidder education and begin a bidder registration period Bid window opens Current Round 1 bid contracts expire CMS announces Round 1 Recompete bid results Bid window closes Implementation of Round 1 bid contracts and prices Infusystem Infusion made easy Spring
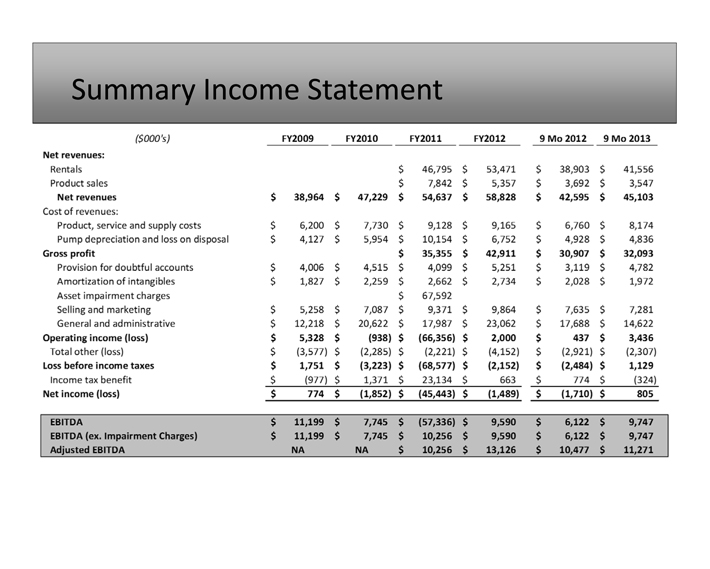
2012 08/16/12 10/15/12 12/14/12 10/1/13 12/31/13 01/01/14 Summary Income Statement ($000 ‘s) FY2009 FY2O1O FY2O11 FY2012 9Mo 2012 9Mo 2013 Net revenues: Cost of revenues: EBITDA $ 11,199 $ 7,745 $ (57,336) $ 9,590 $ 6,122 $ 9,747 EBITDA (ex. Impairment Charges) $ 11,199 $ 7,745 $ 10,256 $ 9,590 $ 6,122 $ 9,747 Adjusted EBITDA NA NA $ 10,256 $ 13,126 $ 10,477 $ 11,271 Rentals $ 46,795 $ 53,471 $ 38,903 $ 41,556 Product sales $ 7,842 $ 5,357 $ 3,692 $ 3,547 Net revenues $ 38,964 $ 47,229 $ 54,637 $ 58,828 $ 42,595 $ 45,103 Product, service and supply costs $ 6,200 $ 7,730 $ 9,128 $ 9,165 $ 6,760 $ 8,174 Pump depreciation and loss on disposal $ 4,127 $ 5,954 $ 10,154 $ 6,752 $ 4,928 $ 4,836 Gross profit $ 35,355 $ 42,911 $ 30,907 $ 32,093 Provision for doubtful accounts $ 4,006 $ 4,515 $ 4,099 S 5,251 $ 3,119 $ 4,782 Amortization of intangibles $ 1,827 $ 2,259 S 2,662 S 2,734 $ 2,028 $ 1,972 Asset impairment charges $ 67,592 Selling and marketing $ 5,258 $ 7,087 $ 9,371 5 9,864 $ 7,635 $ 7,281 General and administrative $ 12,218 5 20,622 $ 17,987 S 23,062 S 17,688 5 14,622 Operating income (loss) $ 5,328 $ (938) $ (66,356) 5 2,000 5 437 $ 3,436 Total other (loss) $ (3,577) $ (2,285) $ (2,221) $ (4,152) $ (2,921) $ (2,307) Loss before income taxes $ 1,751 $ (3,223) $ (68,577) 5 (2,152) $ (2,484) $ 1,129 Income tax benefit Net income (loss) $ (977) 5 1,371 5 23,134 $ 663 $ 774 $ (324) $ 774 $ (1,852) $ (45,443) $ (1,489) $ (1,710) $ 805
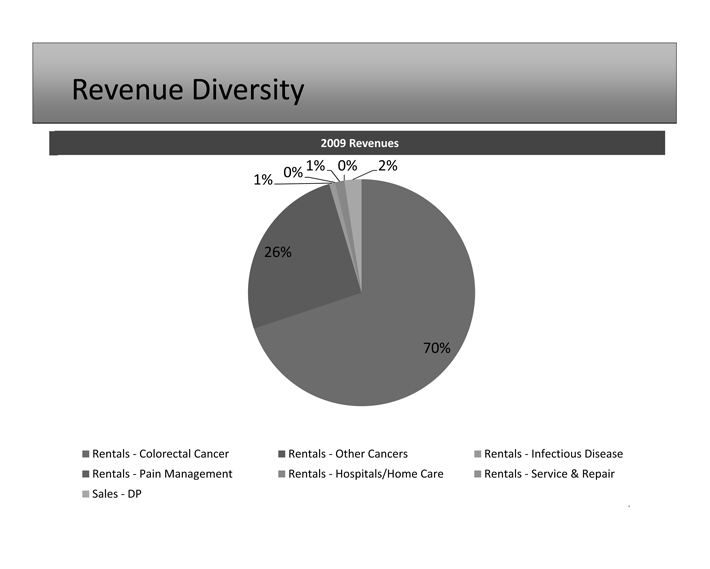
Revenue Diversity 70% 26% 1% 0% 1% 0% 2% 2009 Revenues 2012 Revenues 51% 23% 0% 0% 13% 4% 9% Rentals Colorectal Cancer Rentals Other Cancers Rentals Infectious Disease Rentals Pain Management Rentals Hospitals/Home Care Rentals Service & Repair Sales DP 70% 26% 1% 0%1% 0% 2% 2009 Revenues
Revenue Diversity 70% 26% 1% 0% 1% 0% 2% 2009 Revenues 2012 Revenues 51% 23% 0% 0% 13% 4% 9% Rentals Colorectal Cancer Rentals Other Cancers Rentals Infectious Disease Rentals Pain Management Rentals Hospitals/Home Care Rentals Service & Repair Sales DP
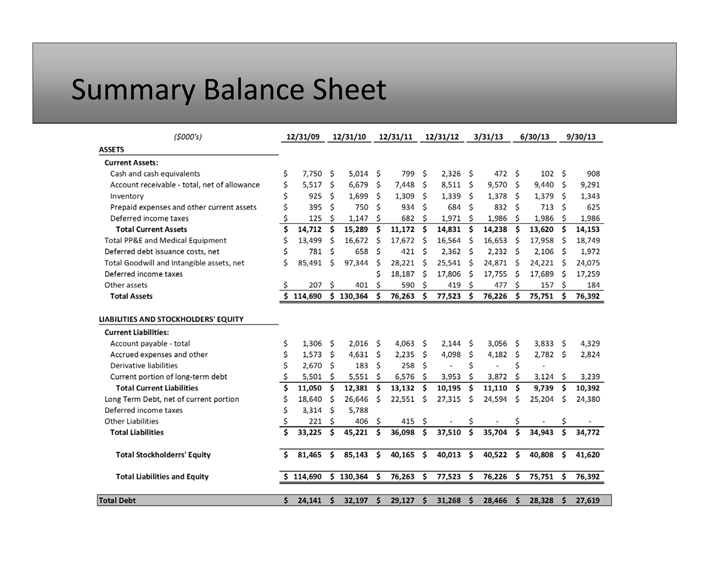
Summary Balance Sheet LIABILITIES AND STOCKHOLDERS EQUITY Current Liabilities: Account payable—total Accrued expenses and other Derivative liabilities Current portion of long-term debt Total Current Liabilities Long Term Debt, net of current portion Deferred income taxes Other Liabilities Total Liabilities Total Stockholderrs’ Equity Total Liabilities and Equity ASSETS ($000 s) 12/31/09 12/31/10 12/31/11 12/31/12 3/31/13 6/30/13 9/30/ 13 Current Assets: Cash and cash equivalents Account receivable—total, net of allowance Inventory Prepaid expenses and other current assets Deferred income taxes Total Current Assets Total PP&E and Medical Equipment Deferred debt issuance costs, net Total Goodwill and Intangible assets, net Deferred income taxes Other assets Total Assets S 7,750 5 5,014 S 799 5 2,326 5 472 5 102 5 908 $ 5,517 $ 6,679 $ 7,448 $ 8,511 $ 9,570 $ 9,440 $ 9,291 $ 925 5 1,699 $ 1,309 $ 1,339 5 1,378 $ 1,379 S 1,343 5 395 5 750 $ 934 5 684 5 832 5 713 5 625 $ 125 5 1,147 5 682 5 1,971 5 1,986 5 1,986 5 1,986 S 14,712 $ 15,289 S 11,172 5 14,831 S 14,238 S 13,620 5 14,153 $ 13,499 $ 16,672 $ 17,672 $ 16,564 $ 16,653 $ 17,958 $ 18,749 5 781 $ 658 S 421 S 2,362 5 2,232 5 2,106 S 1,972 $ 85,491 $ 97,344 $ $ 28,221 18,187 5 $ 25,541 17,806 $ 5 24,871 17,755 $ $ 24,221 17,689 $ 5 24,075 17,259 5 207 $ 401 5 590 5 419 5 477 $ 157 5 184 $ 114,690 $ 130,364 S 76,263 5 77,523 $ 76,226 5 75,751 $ 76,392 $ 1,306 $ $ 1,573 $ $ 2,670 $ $ 5,501 $ 2,016 4,631 183 5,551 $ 4,063 $ 2,235 $ 258 $ 6,576 $ 2,144 $ $ 4,098 $ $—$ $ 3,953 $ 3,056 4,182 3,872 $ 3,833 $ $ 2,782 $ $—$ 3,124 $ 4,329 2,824 3,239 $ 11,050 $ 12,381 5 13,132 5 10,195 5 11,110 5 9,739 5 10,392 5 18,640 $ 26,646 5 22,551 5 27,315 $ 24,594 $ 25,204 5 24,380 5 3,314 $ 5,788 5 221 $ 406 $ 415 5—5—S—S—5 33,225 $ 45,221 5 36,098 5 37,510 $ 35,704 5 34,943 5 34,772 5 81,465 $ 85,143 $ 40,165 5 40,013 $ 40,522 $ 40,808 $ 41,620 $ 114,690 $ 130,364 5 76,263 5 77,523 5 76,226 5 75,751 5 76,392 Total Debt $ 24,141 $ 32,197 $ 29,127 $ 31,268 $ 28,466 $ 28,328 $ 27,619 I
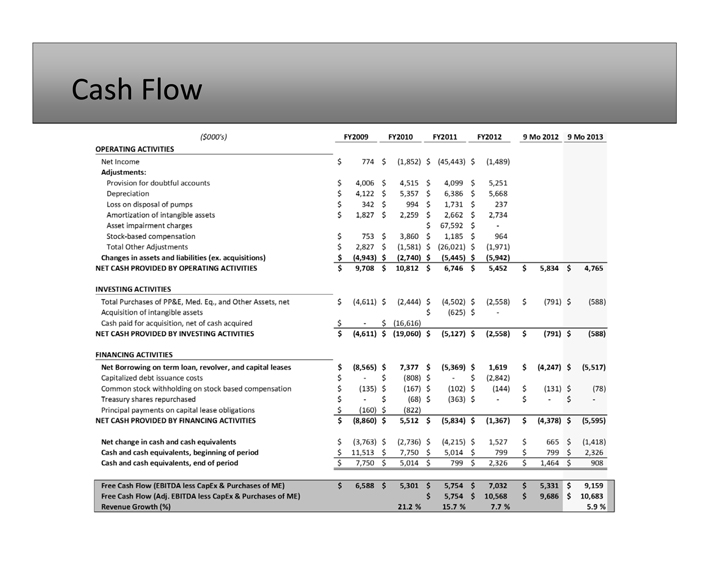
Cash Flow ($0 00’s) FY2009 FY2O1O FYZO11 FY2012 9Mo2012 9Mo2013 OPERATING ACTIVITIES Net Income Adjustments: Provision for doubtful accounts Depreciation Loss on disposal of pumps Amortization of intangible assets Asset impairment charges Stock-based compensation Total Other Adjustments changes in assets and liabilities (ex. acquisitions) NET CASH PROVIDED BY OPERATING ACTIVITIES INVESTING ACTIVITIES Total Purchases of PP&E, Med. Eq., and Other Assets, net Acquisition of intangible assets Cash paid for acquisition, net of cash acquired NET CASH PROVIDED BY INVESTING ACTIVITIES FINANCING ACTIVITIES Net Borrowing on term loan, revolver, and capital leases Capitalized debt issuance costs Common stock withholding on stock based compensation Treasury shares repurchased Principal payments on capital lease obligations NET CASH PROVIDED BY FINANCING ACTIVITIES Net change in cash and cash equivalents Cash and cash equivalents, beginning of period Cash and cash equivalents, end of period $ 4,099 $ $ 6,386 $ $ 1,731 $ $ 2,662 $ $ 67,592 $ $ 1,185 $ $ (26,021) $ $ (5,445) $ Free Cash Flow (EBITDA less CapEx & Purchases of ME) $ 6,588 $ 5,301 S 5,754 5 7,032 5 5,331 5 9,159 Free Cash Flow (Adj. EBITDA less CapEx & Purchases of ME) 5 5,754 $ 10,568 $ 9,686 $ 10,683 Revenue Growth (%) 21.2% 15.7 % 7.7% 5.9% $ 774 $ (1,852) $ (45,443) $ (1,489) $ 4,006 $ 4,122 $ 342 $ 1,827 $ 753 $ 2,827 $ (4,943) $ $ $ $ $ $ $ 4,515 5,357 994 2,259 3,860 (1,581) (2,740) 5,251 5,668 237 2,734 964 (1,971) (5,942) $ 9,708 $ 10,812 $ 6,746 $ 5,452 S 5,834 $ 4,765 5 (4,611) $ (2,444) $ $ (4,502) $ (625)$ (2,558)—5 (791) $ (588) $—$ (16,616) $ (4,611) $ (19,060) $ (5,127) $ (2,558) $ (791) $ (588) $ (8,565) $ 7,377 $ (5,369) $ 1,619 $ (4,247) $ (5,517) $—$ (808) $—$ (2,842) $ (135) $ (167) $ (102) $ (144) $ (131) $ (78) S—$ (68) $ (363) $—$—$—5 (160) $ (822) 5 (8,860) $ 5,512 $ (5,834) $ (1,367) 5 (4,378) $ (5,595) $ (3,763) $ (2,736) $ (4,215) $ 1,527 $ 665 $ (1,418) $ 11,513 $ 7,750 $ 5,014 $ 799 $ 799 $ 2,326 $ 7,750 $ 5,014 $ 799 $ 2,326 5 1,464 $ 908
Take Away Infusystem Infusion made easy
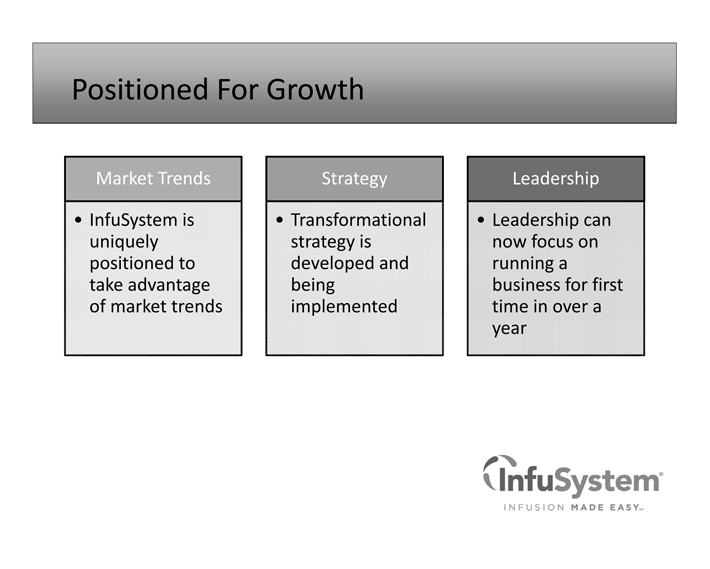
Positioned For Growth Infusystem Infusion made easy Market Trends • InfuSystemis uniquely positioned to take advantage of market trends Strategy • Transformational strategy is developed and being implemented Leadership • Leadership can now focus on running a business for first time in over a year
Thank You for Your Interest! Infusystem Infusion made easy IR Contact Info: The Dilenschneider Group 2129220900 Rob Swadosh, rswadosh@dginyc.com Patrick Malone, pmalone@dginyc.com
Appendix: INFU Overview Infusystem Infusion made easy
2 1 28 47 14 18 2 26 7 7 27 19 28 12 2 13 12 25 18 1 3 31 13 59 7 2 1 Servicing all 50 States & Canada “In network” in over 250 health plans covering 222+mm lives 1,600+ active healthcare facilities in Third Party Payor business InfuSystem Overview Rentals, Sales & Services Size & Scale Third Party Payor: Ambulatory Oncology Services Provides ambulatory infusion pumps (rentals & sales) to oncology clinics, hospitals and other healthcare providers InfuSystem directly bills patients’ commercial health insurance providers, Medicare and Medicaid or patients for pump use Offers a complete solution that benefits providers, patients and payors Direct Payor: Movable Medical Equipment Products & Services Sales, rentals, financing, servicing and certification of pumps, defibrillators, disposables and other medical equipment Transacts directly with healthcare providers – no third party reimbursement billing 2,500+ active customers in Direct Payor business (1) Financial Profile ($mm) $39.0 $47.2 $54.6 $58.8 $42.6 $45.1 $0m $10m $20m $30m $40m $50m $60m $70m 2009 2010 2011 2012 9M 2012 9M 2013 Revenues ($ millions) NA NA $10.3 $13.1 $10.5 $11.3 $0m $2m $4m $6m $8m $10m $12m $14m 2009 2010 2011 2012 9M 2012 9M 2013 Adjusted EBITDA ($ millions) $6.6 $5.3 $5.8 $7.0 $5.3 $9.2 $0m $1m $2m $3m $4m $5m $6m $7m $8m $9m $10m 2009 2010 2011 2012 9M 2012 9M 2013 Free Cash Flow 1 ($ millions)
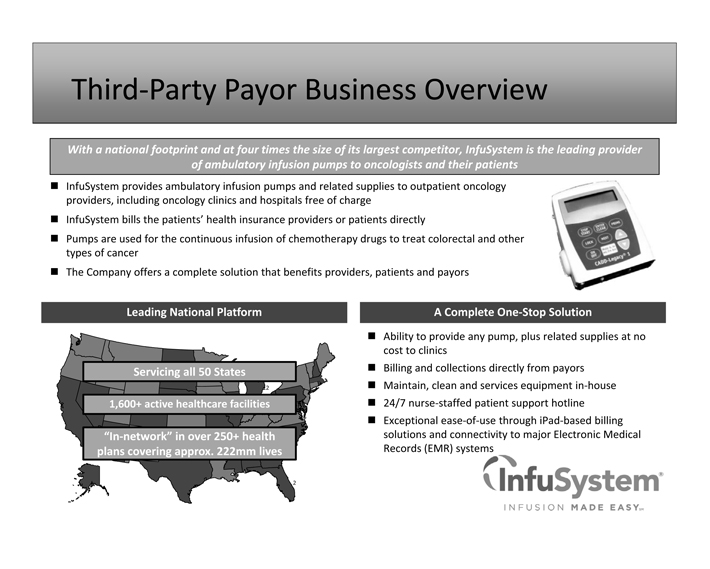
Infusystem Infusion made easy With a national footprint and at four times the size of its largest competitor, InfuSystem is the leading provider of ambulatory infusion pumps to oncologists and their patients InfuSystem provides ambulatory infusion pumps and related supplies to outpatient oncology providers, including oncology clinics and hospitals free of charge InfuSystem bills the patients’ health insurance providers or patients directly Pumps are used for the continuous infusion of chemotherapy drugs to treat colorectal and other types of cancer The Company offers a complete solution that benefits providers, patients and payors A Complete One Stop Leading National Platform Solution Ability to provide any pump, plus related supplies at no cost to clinics Billing and collections directly from payors Maintain, clean and services equipment in house 24/7 nurse staffed patient support hotline Exceptional ease of use through iPad based billing solutions and connectivity to major Electronic Medical Records (EMR) systems 2 1 28 47 14 18 2 26 7 7 27 19 28 12 2 13 12 25 18 1 3 31 13 59 7 2 1 Servicing all 50 States “In network” in over 250+ health plans covering approx. 222mm lives 1,600+ active healthcare facilities Third Party Payor Business Overview
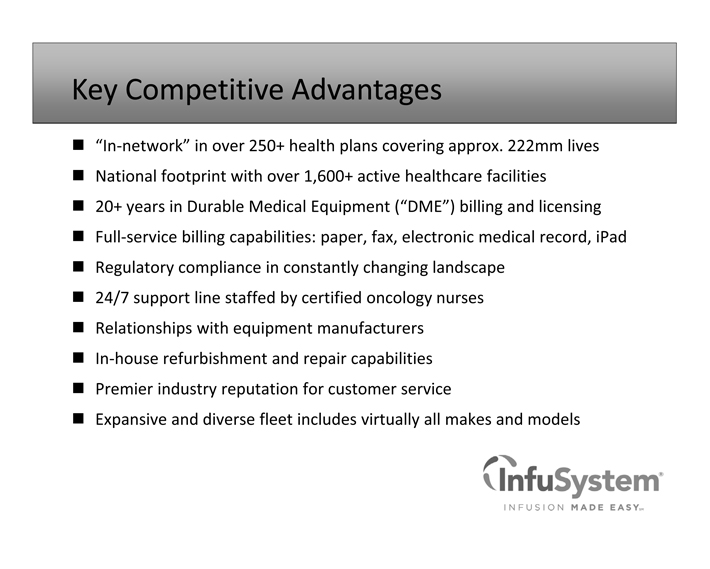
Key Competitive Advantages Infusystem Infusion made easy “In network” in over 250+ health plans covering approx. 222mm lives National footprint with over 1,600+ active healthcare facilities 20+ years in Durable Medical Equipment (“DME”) billing and licensing Full service billing capabilities: paper, fax, electronic medical record, iPad Regulatory compliance in constantly changing landscape 24/7 support line staffed by certified oncology nurses Relationships with equipment manufacturers In house refurbishment and repair capabilities Premier industry reputation for customer service Expansive and diverse fleet includes virtually all makes and models
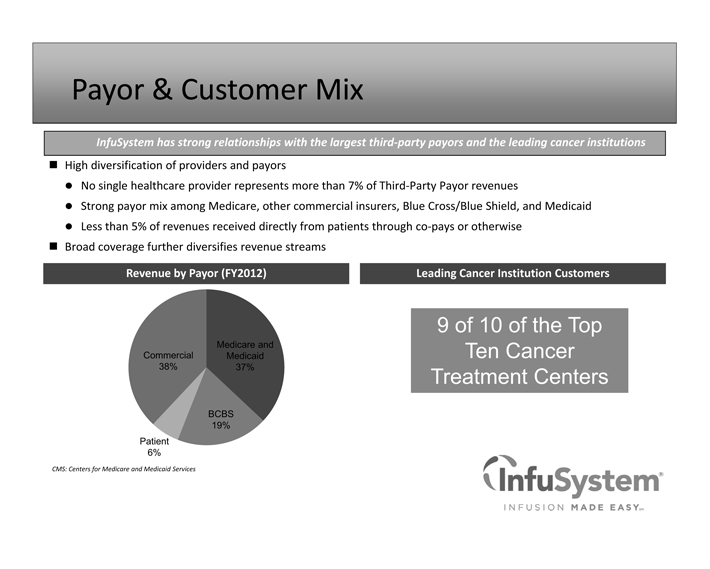
Payor & Customer Mix Infusystem Infusion made easy Leading Cancer Institution CustomerRevenue by Payor (FY2012) s High diversification of providers and payors No single healthcare provider represents more than 7% of Third Party Payor revenues Strong payor mix among Medicare, other commercial insurers, Blue Cross/Blue Shield, and Medicaid Less than 5% of revenues received directly from patients through co pays or otherwise Broad coverage further diversifies revenue streams InfuSystem has strong relationships with the largest third party payors and the leading cancer institutions CMS: Centers for Medicare and Medicaid Services Medicare and Medicaid 37% BCBS 19% Patient 6% Commercial 38% 9 of 10 of the Top
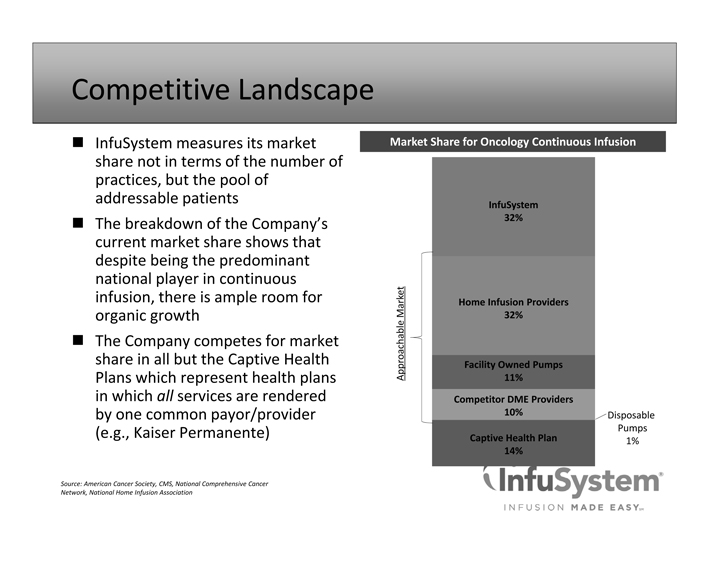
Competitive Landscape Infusystem Infusion made easy InfuSystem measures its market share not in terms of the number of practices, but the pool of addressable patients The breakdown of the Company’s current market share shows that despite being the predominant national player in continuous infusion, there is ample room for organic growth The Company competes for market share in all but the Captive Health Plans which represent health plans in which all services are rendered by one common payor/provider (e.g., Kaiser Permanente) Market Share for Oncology Continuous Infusion Source: American Cancer Society, CMS, National Comprehensive Cancer Network, National Home Infusion Association InfuSystem 32% Home Infusion Providers 32% Facility Owned Pumps 11% Competitor DME Providers 10% Disposable Pumps Captive Health Plan 1% 14% Approachable Market
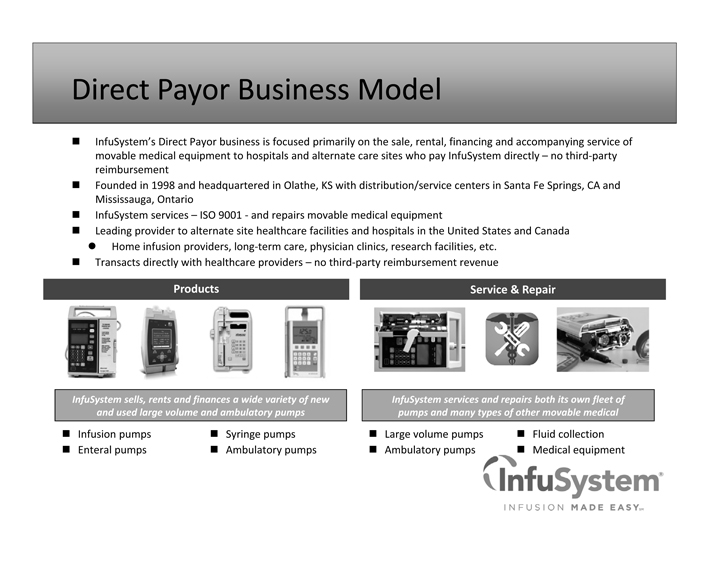
Infusion pumps Enteral pumps Direct Payor Business Model Infusystem Infusion made easy InfuSystem’s Direct Payor business is focused primarily on the sale, rental, financing and accompanying service of movable medical equipment to hospitals and alternate care sites who pay InfuSystem directly – no third party reimbursement Founded in 1998 and headquartered in Olathe, KS with distribution/service centers in Santa Fe Springs, CA and Mississauga, Ontario InfuSystem services – ISO 9001 and repairs movable medical equipment Leading provider to alternate site healthcare facilities and hospitals in the United States and Canada Home infusion providers, long term care, physician clinics, research facilities, etc. Transacts directly with healthcare providers – no third party reimbursement revenue Service & ReProducts pair InfuSystem sells, rents and finances a wide variety of new and used large volume and ambulatory pumps InfuSystem services and repairs both its own fleet of pumps and many types of other movable medical equipment Syringe pumps Ambulatory pumps Large volume pumps Ambulatory pumps Fluid collection Medical equipment
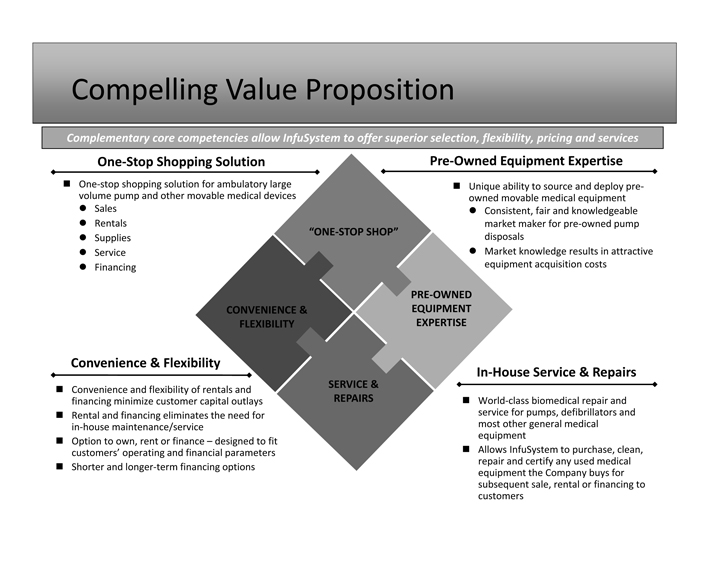
Compelling Value Proposition In?House Service & Repairs Convenience & Flexibility Pre?Owned Equipment One?Stop Shopping Solution Expertise ? Convenience and flexibility of rentals and financing minimize customer capital outlays ? Rental and financing eliminates the need for in?house maintenance/service ? Option to own, rent or finance – designed to fit customers’ operating and financial parameters ? Shorter and longer?term financing options ? One?stop shopping solution for ambulatory large volume pump and other movable medical devices ? Sales ? Rentals ? Supplies ? Service ? Financing ? World?class biomedical repair and service for pumps, defibrillators and most other general medical equipment ? Allows InfuSystem to purchase, clean, repair and certify any used medical equipment the Company buys for subsequent sale, rental or financing to customers “ONE?STOP SHOP” SERVICE & REPAIRS CONVENIENCE & FLEXIBILITY PRE?OWNED EQUIPMENT EXPERTISE ? Unique ability to source and deploy preowned movable medical equipment ? Consistent, fair and knowledgeable market maker for pre?owned pump disposals ? Market knowledge results in attractive equipment acquisition costs Complementary core competencies allow InfuSystem to offer superior selection, flexibility, pricing and services
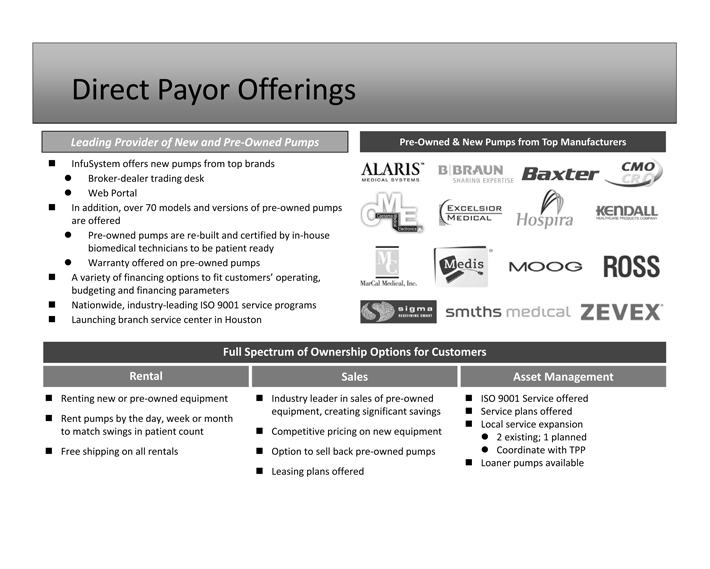
? InfuSystem offers new pumps from top brands ? Broker?dealer trading desk ? Web Portal ? In addition, over 70 models and versions of pre?owned pumps are offered ? Pre?owned pumps are re?built and certified by in?house biomedical technicians to be patient ready ? Warranty offered on pre?owned pumps ? A variety of financing options to fit customers’ operating, budgeting and financing parameters ? Nationwide, industry?leading ISO 9001 service programs ? Launching branch service center in Houston Direct Payor Offerings Pre?Owned & New Pumps from Top Manufacturers Full Spectrum of Ownership Options for Customers Rental Sales Asset Management ? Renting new or pre?owned equipment ? Rent pumps by the day, week or month to match swings in patient count ? Free shipping on all rentals ? Industry leader in sales of pre?owned equipment, creating significant savings ? Competitive pricing on new equipment ? Option to sell back pre?owned pumps ? Leasing plans offered ? ISO 9001 Service offered ? Service plans offered ? Local service expansion ? 2 existing; 1 planned ? Coordinate with TPP ? Loaner pumps available Leading Provider of New and Pre?Owned Pumps
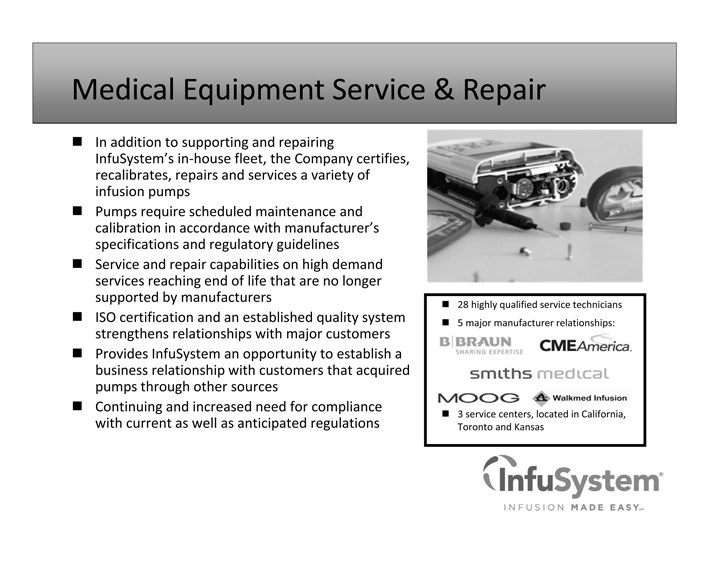
Medical Equipment Service & Repair Infusystem Infusion made easy ? In addition to supporting and repairing InfuSystem’s in?house fleet, the Company certifies, recalibrates, repairs and services a variety of infusion pumps ? Pumps require scheduled maintenance and calibration in accordance with manufacturer’s specifications and regulatory guidelines ? Service and repair capabilities on high demand services reaching end of life that are no longer supported by manufacturers ? ISO certification and an established quality system strengthens relationships with major customers ? Provides InfuSystem an opportunity to establish a business relationship with customers that acquired pumps through other sources ? Continuing and increased need for compliance with current as well as anticipated regulations ? 28 highly qualified service technicians ? 5 major manufacturer relationships: ? 3 service centers, located in California, Toronto and Kansas Ten Cancer Treatment Centers